
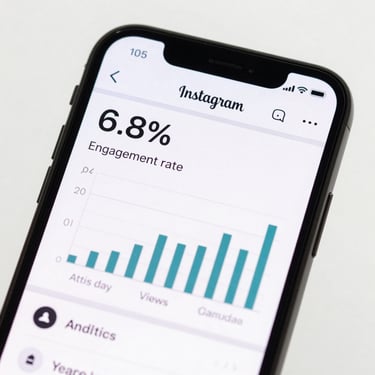
We run social and paid campaigns against qualified-lead targets and pipeline value. Reach and impressions are a by-product, not the objective.
Numbers from active client campaigns.
All figures drawn from live campaigns across B2C and B2B clients. CPL and ROAS verified against CRM data, not platform estimates.
3.8×
₹186
41%
2.1×
Median cost-per-qualified-lead for a service-sector client running Instagram and Search in parallel.
Organic reach increase within 60 days for a personal brand account after a full content-strategy overhaul.
Average ROAS across Meta and Google paid campaigns for e-commerce clients over a 90-day window.
Improvement in inbound lead volume for a B2B startup after SEO and LinkedIn content ran in coordination.


Assets that hold value past the algorithm.
Reels, brand shoots, and written content are briefed against audience segments and conversion stages — not against what performed on a competitor's feed last week.
Every asset is mapped to a funnel stage before production begins. The result is a content library that compounds over months, not one that expires in 48 hours.
See exactly where your current spend is leaking.
A performance audit maps your active channels against qualified-lead output and identifies which parts of your funnel are costing you without returning revenue.